
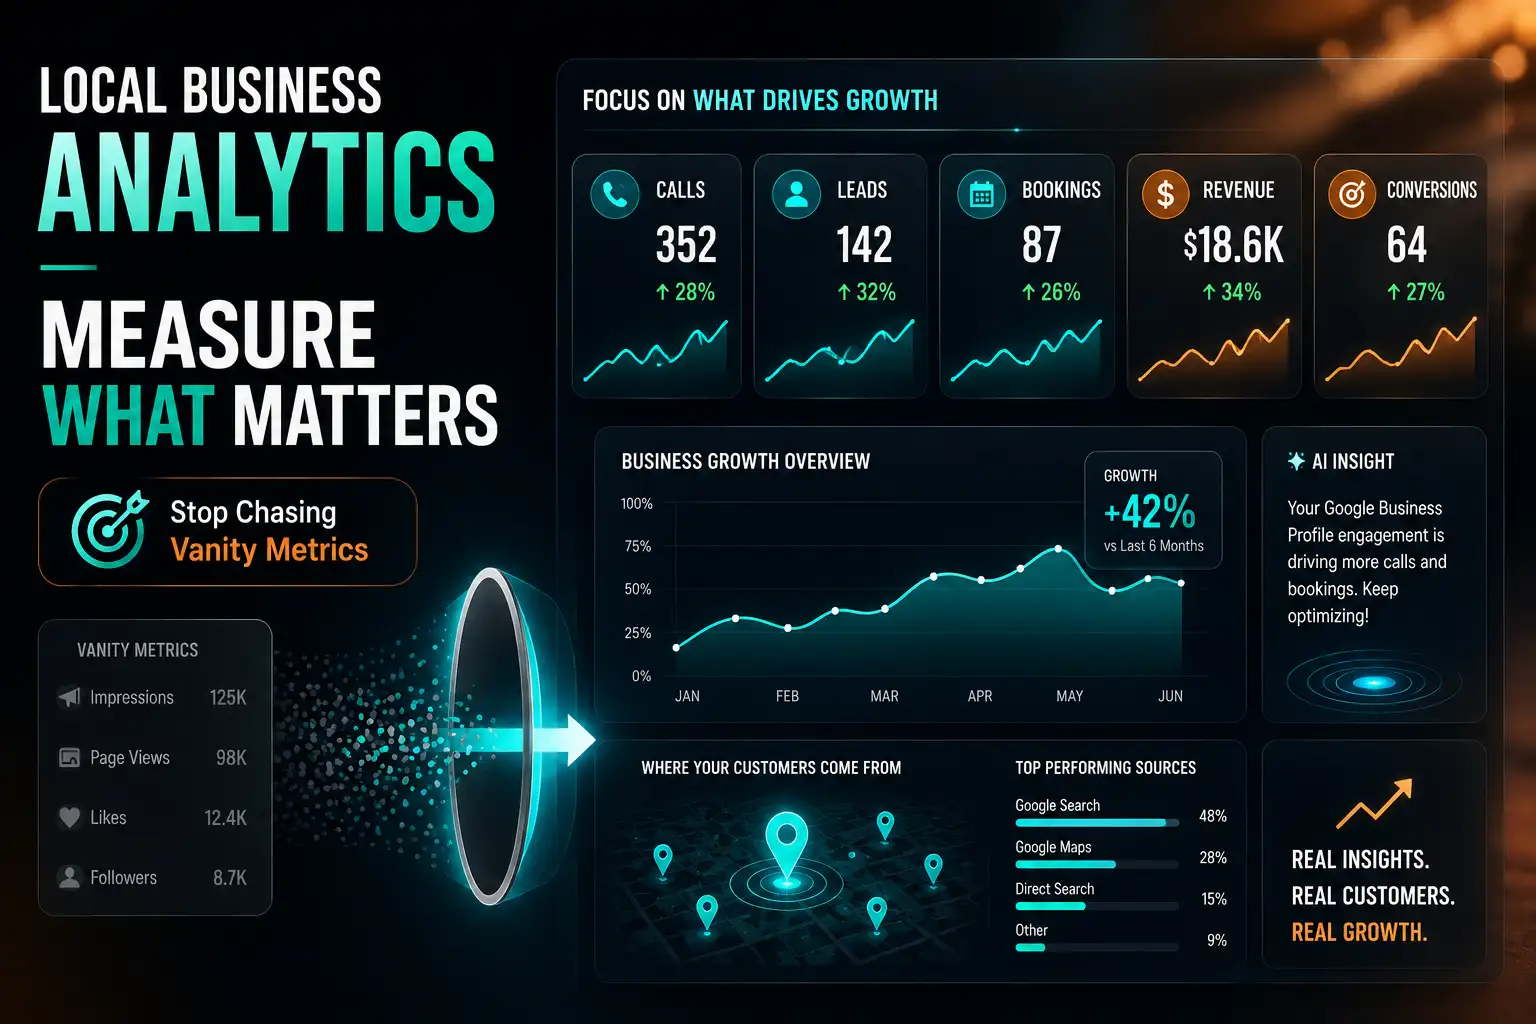
Most local businesses track the wrong numbers. Learn the specific analytics and KPIs that actually predict revenue growth and how to set up a simple, practical reporting system that drives real decisions.
Data-driven decision making is a competitive advantage in local marketing but only when you’re tracking the right data. Many business owners invest time in monitoring metrics that feel important but don’t actually predict business outcomes: social media follower counts, total website sessions, or overall Google ranking position without segmenting by keyword intent. These vanity metrics create a false sense of progress while obscuring the specific performance signals that actually predict revenue growth.
The local business analytics framework that drives real decisions starts with defining what “working” means for each channel. For your Google Business Profile, the metrics that matter are calls made, direction requests, website clicks, and if you have booking enabled direct bookings from the profile. Profile views are a lagging indicator; actions are the leading indicator of revenue.
For your website, the meaningful metrics are not total sessions but rather sessions that convert contact form submissions, phone calls initiated from click-to-call, booking completions, and live chat conversations. A website that generates 2,000 sessions and 5 conversions is underperforming relative to a website that generates 800 sessions and 25 conversions. Conversion rate optimization delivers more value per marketing dollar than traffic generation for most local businesses.
For your directory listings, including Biz Lookup Now, track the profile views, click-to-call actions, website referrals, and direct inquiry forms attributed to each listing. Most quality directories provide this analytics data in their dashboards, and the numbers should be reviewed monthly to assess listing performance and identify optimization opportunities.
For your review profile, track review velocity (new reviews per month), average rating trend, and response rate each of these has direct implications for both ranking and conversion performance. A declining review velocity often precedes a ranking decline; catching it early allows proactive intervention.
For your overall local SEO program, Google Search Console provides the most direct ranking and traffic data: impressions, clicks, and average position for every query driving traffic to your site. Filter by local intent queries to focus on the performance data most relevant to your local business goals.
Frequently Asked Questions
Q: How should I set up goal tracking in Google Analytics for local business conversions?
A: Create Goals (or Events in GA4) for each key conversion action: contact form submissions, phone number clicks, direction requests from your embedded map, and any booking or quote request completions. Assign estimated values to each conversion type to calculate channel ROI. Google Tag Manager makes implementing these tracking events easier for non-technical business owners.
Q: How often should I review my local business analytics?
A: Review GBP Insights and directory analytics weekly these provide early signals of ranking and visibility changes. Conduct a broader monthly review of website analytics, review portfolio metrics, and paid search performance. Do a comprehensive quarterly analysis of all channels combined to inform strategic decisions.
Q: What should I do when an analytics metric looks bad?
A: Diagnose before acting. A drop in GBP profile views might indicate a ranking change check your local pack placement for your key queries. A drop in website conversion rate might indicate a technical issue, a UX problem, or a shift in traffic quality. Understanding the cause before implementing changes prevents well-intentioned actions from creating new problems.